


🦄 SaaS Startups: Forecasting Your Customer Acquisition Cost
Customer Acquisition Cost (CAC) is one of the most important KPIs you must track as a SaaS startup. Understanding and determining it precisely are crucial to your company and your fundraising efforts.

Welcome to the 81 new Fundraisedd people who have joined us since last Monday. If you’re reading this but haven’t subscribed yet, join the Fundraisedd community now by clicking this here button:
Hi friends,
Welcome to the second edition of Fundraisedd, the weekly newsletter that tells you all you need to know about fundraising and startup finance.
This week, we’re going to be a bit more technical.
The second most common reason for startup failure, behind lack of product-market fit, is “running out of cash.” This can happen for a multitude of reasons within ou without the reach of the founders and the team.
The problem of cash management is exacerbated in early-stage SaaS startups for a simple reason: the economics of SaaS companies are complicated and based on arcane metrics that are hard to understand.
Today, we’re going to dive deeper into one of these metrics: the Customer Acquisition Cost (CAC). You’ll see that this indicator can have a dramatic effect on your cash burn and, consequently, should be at the centre of your preoccupations when raising funds.
So without further ado, let’s jump in!
How to calculate your CAC
When searching online for “How to calculate Customer Acquisition Cost?” you will find thousands of pages describing the same formula, like these:
Basically, the CAC can be calculated by simply dividing all the costs spent on acquiring more customers (marketing expenses) by the number of customers acquired in the period the money was spent. — neilpatel.com
Customer Acquisition Cost = Cost of Sales and Marketing divided by the Number of New Customers Acquired. — hubspot.com
You get the idea. They all tell you the same thing.
Unfortunately for the early-stage entrepreneur trying to build their financial model and raise funds, this equation has two fundamental flaws:
First, it is backwards looking — You can easily compute your CAC at the end of your fiscal year when your accounts are closed, but what good does it do to you when you don’t have the track record? When you don’t know the figures?
Second, it leads to the wrong conclusion — The equation mathematically implies that the more new customers you acquire, the lower your CAC, which is not obviously true. The more new customers, the more free users or trials, the more customer support tickets, sales calls or emails,…
So how can you do it, how can you forecast your CAC with a forward-looking, customer-based method?
Reverse engineering your sales funnel

One way to achieve it is to reverse engineer your sales funnel.
Let’s take the example of an early-stage SaaS startup, SaaSquatch Inc. The company is launching its seed round and its founders are currently working on their financial projections.
They need to decide how much to raise and they know that CAC is a crucial KPI to ascertain.
They want to operate a freemium model with a $15/mo premium plan. Their leads will come from Facebook ads.
After a few web searches on the topic of conversion rates, they can build the following table:

Sources: trial conversion rates, signup
Where:
The columns represent the conversion rates from free to paying;
The rows the conversion rate from visitor to signup; and
The values represent the ratio between 1 paying customer and the number of visitors to your websites.
Now, SaaSquatch founders are optimistic and aim for a signup rate of 20% and a conversion rate of 5%.
They know they will have to attract 100 people to their website to gain a new paying customer.
They also target 500 paying customers the first month, growing by 50 new customers each month.
We can now visualise their sales funnel over 12 months:

Another quick internet search tells you that the average CTR for Facebook ads is 0.9% and the Cost Per Mille (CPM) for lead generation on Facebook is around $14. Once again, our entrepreneurs are confident they can do better and aim for a CTR of 1.2%.
They expand their funnel and finally get their total ad spend:

The price of their service being low at the moment ($15/month), SaaSquatch doesn’t intend on recruiting sales reps. The founders plan to handle most of the work and will hire customer support people as needed. They budget an extra $100’000 on Sales & Marketing but aren’t sure of the figure.
Eventually, SaaSquatch Inc.’s total cost to acquire 9’300 paying customers is $1’185’000.
This leads to a CAC of $127.42.
The economics of SaaS companies
Now, why is CAC so important for SaaSquatch’s fundraising round?
This is because the economics of the SaaS business model is weirdly complicated.
If the company were to sell its product as a one-off, standalone item for $250, its cash flow would look like this:

We can see that both cash flow events happen at roughly the same time. From an accounting perspective, Revenue, EBITDA, and Cash Flow happen in the same period. SaaSquatch would either succeed in selling or fail at it, but once the sale is done, cash is in.
With a subscription, however, things are dramatically different:

The initial cash outlay is far greater than the monthly revenue, which means SaaSquatch will have to wait a specific number of months to recover its CAC and make money on its paying users. We call this the payback period.
Assuming a gross margin of 90%, SaaSquatch’s payback period will be equal to its CAC divided by its monthly subscription price times the gross margin, or:
$124.70 / ( $15 * 90%) = 9.23 months
This metric is fundamental to our company, as it means that for the first 9.23 months of the subscriber's life, SaaSquatch will operate with negative cash flow.
It also means that SaaSquatch cannot lose a paying customer in its first 9 months, or else they will lose money.
Managing your churn rate is a fundamental aspect of the SaaS business model that, unfortunately, we won’t have time to cover today. But if you’re interested, let me know and I’ll write a specific essay on it!
For the moment, let’s assume SaaSquatch forecasts a monthly churn rate of 2.5% and let’s roll with it.
The importance of CAC in fundraising
Now that we have all the required data, let’s chart SaaSquatch’s monthly cash flow, not for a single customer, but its target 9’300 clients in the first year. Let’s also look a bit further in the future with the same parameters.

Looking now at the Net Monthly Cash Flow:
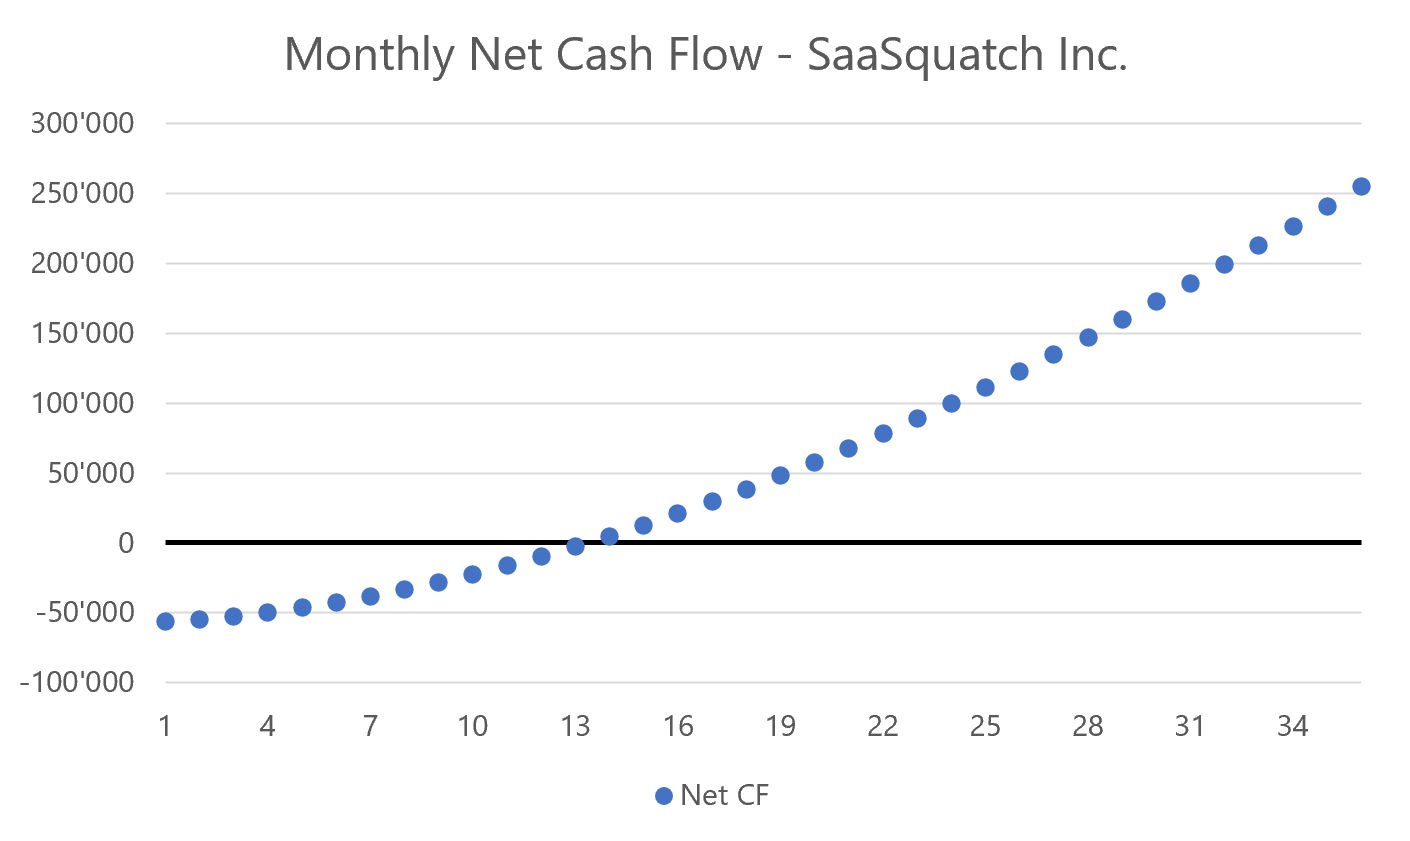
We see that on a net cash flow basis, SaaSquatch will break even around month 13.
Don’t forget, it takes a little over 9 months for the company to break even on a single customer, but the churn rate has a massive impact on your cash flow and revenue streams.
Finally, looking at the company’s Cumulated Cash Flow:

We see that with the assumptions they’ve made, SaaSquatch will face a liquidity crunch over their first 24 months, with the minimum being $451’433 at month 13. And remember, our model does not include any other costs than the sales funnel!
Luckily for SaaSquatch, fixed costs like office rent, salaries, and expenses can be forecasted and managed with more certainty than its CAC and its growth rate.
Their model, however, is based on many assumptions that could prove wrong. SaaSquatch must understand how a slight variation in any of its conversion rates or ad costs can change its cumulated cash flow and, consequently, how it affects their fundraising targets.
They must run what is usually called sensitivity analyses.

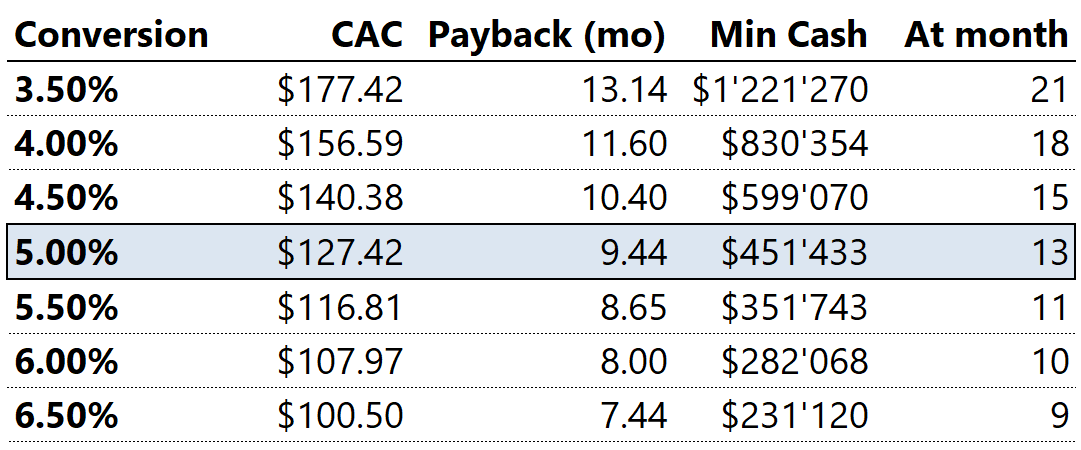
We immediately see that a slight variation in the CTR or the conversion rate leads to massive swings in the CAC which, in turn, can create a much deeper cash trough.
If SaaSquatch intended to raise a $1.5M round with a 24-month milestone of breaking even, allocating $500k to its sales funnel and $1M towards general and admin costs, a variation of 0.30% in its CTR could shorten its runway by a full year. The same thing would happen if their conversion rate suddenly dropped to 4%.
Perhaps a $1.5M round is not enough after all.
One last hurdle: growth!
Now, a fascinating aspect of SaaS economics is that the faster you grow, the more money you lose!
Of course, over the long term, revenue growth is one of the determining factors of success for any SaaS companies, but in the short term, the faster you grow, the more cash you burn.
Here is the above Cumulated Cash Flow chart assuming the base-case growth scenario (+50 users a month) and two other, more aggressive ones: +100 and +200 users a month.
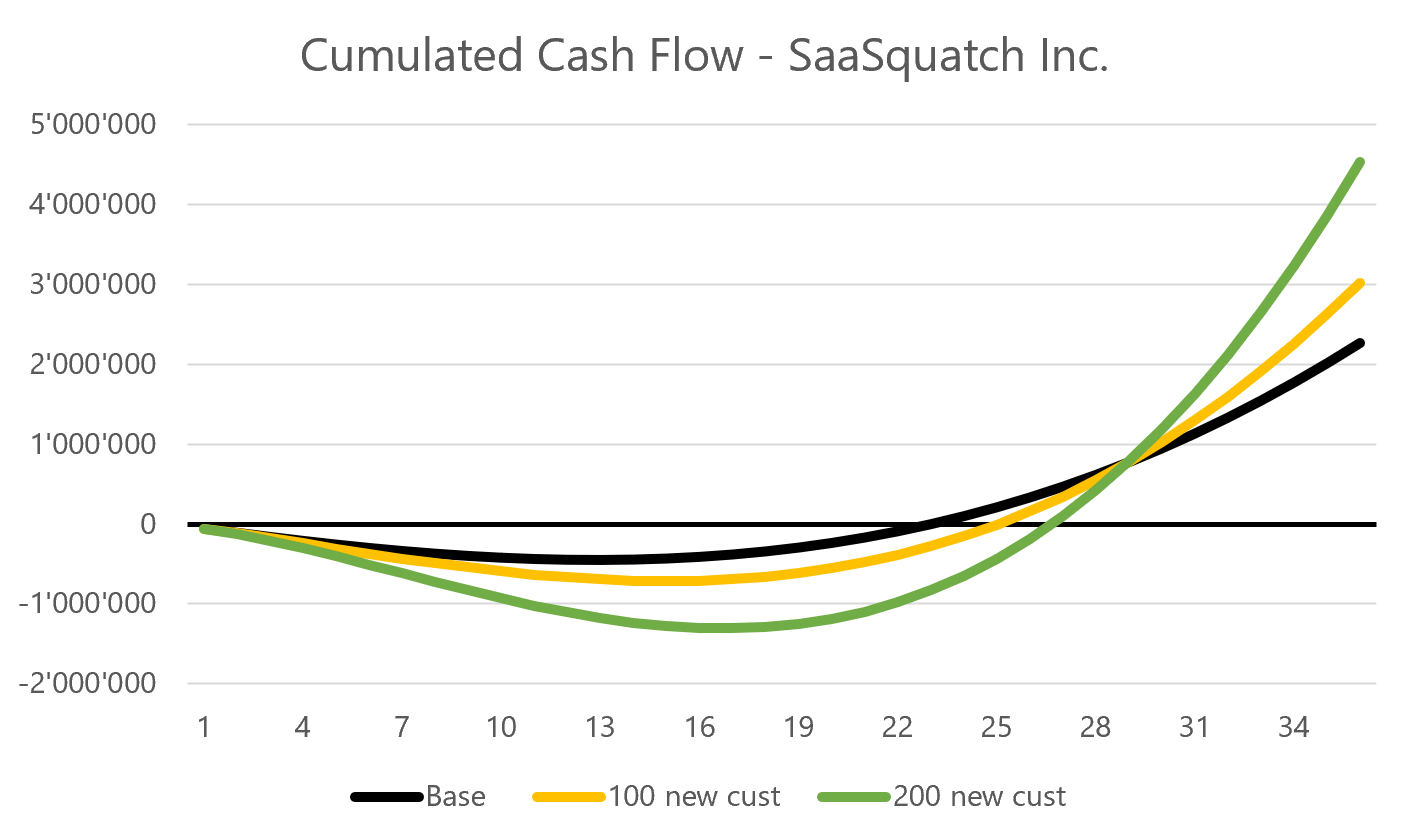
Compared to the base scenario, we observe that the greater the growth, the greater the cash crunch and the later its minimum happens.
Base scenario — Minimum $451’433 — Month 13
+100 / month — Minimum $714’990 — Month 15
+200 / month — Minimum $1’307’439 — Month 17
Once again, if you had planned a cash trough of $500k and a two-year runway, faster-than-expected growth will deepen the former and shorten the latter to a dangerous degree.
In a SaaS startup, explosive growth can hurt you.
While you might not have trouble raising another round if you suddenly have twice the growth you expected, it will still put incredible pressure on your cash flow and might force you to raise with less than ideal conditions. You never want to raise being cash-strapped.
Concluding remarks
This essay addresses only a fraction of the SaaS business model’s complexity and does it through a specific, narrow example.
Your situation, your sales process, your lead generation channels, all these might be different, but the fundamental logic remains:
You must forecast your CAC as precisely as possible and use it to chart your cumulated Cash Flow over your strategic horizon to understand how much cash you will need to finance your sales growth.
Once this is done, adding the other fixed costs on top is the easy part.
Finally, it is important to note that while a poor performance on one of the metrics can dramatically shorten your runway, the opposite is also true.
In our example, improving the CTR by 0.1% saves roughly $100k for SaaSquatch Inc, giving them 2 extra months runway on their round.
I hope you enjoyed this more technical essay and, should you have questions or feedback, please leave a comment below!
Pitch Deck Teardowns
This week, I’d like to share with you two great pitch decks I’ve torn down by two early-stage companies:
DocSend, a seed round deck that raised $1.7M in 2013
Coinbase, a demo day deck that raised $600k in seed funding in 2012
Suggested reading
Can You Still Make Money Starting a SaaS Company? — Tomasz Tunguz, VC @ Redpoint
SaaS Metrics: VCs Share the 7 Key Metrics You Need to Track — Geckoboard
Thanks for reading till the end, have a great week!
Hi Nicolas, great post, thank you! Would you be willing to share the Excel file these tables and charts came out of? I'm running a SaaS company and these would be super helpful, thanks!